Visualizing measurements#
Up to this point, you parsed the readings of your measurements of Lu-177 from the Hidex 300 SL automatic liquid scintillator counter CSV files, and processed the to get the background, sample and net measurements. Now you have all this information organized and stored in tables. The next thing you may want to do is visualize the measurements.
Visualizing the measurements allow you to find patterns in the measurements,
check if everything went well or if something may have gone wrong during the measurements,
diagnose what may have gone wrong if it seems so, or decide if you need to repeat the measurements.
Let’s see how you can do this using the Hidex300 class.
Plot background measurements#
Take the processor from the previous section.
Let’s get some plots of the quantities of interest for the background measurements.
To do this, use the processor.plot_measurements() method and
specifying the type of measurement you want to process:
>>> processor.plot_measurements(kind='background')
The returned plot will look like:
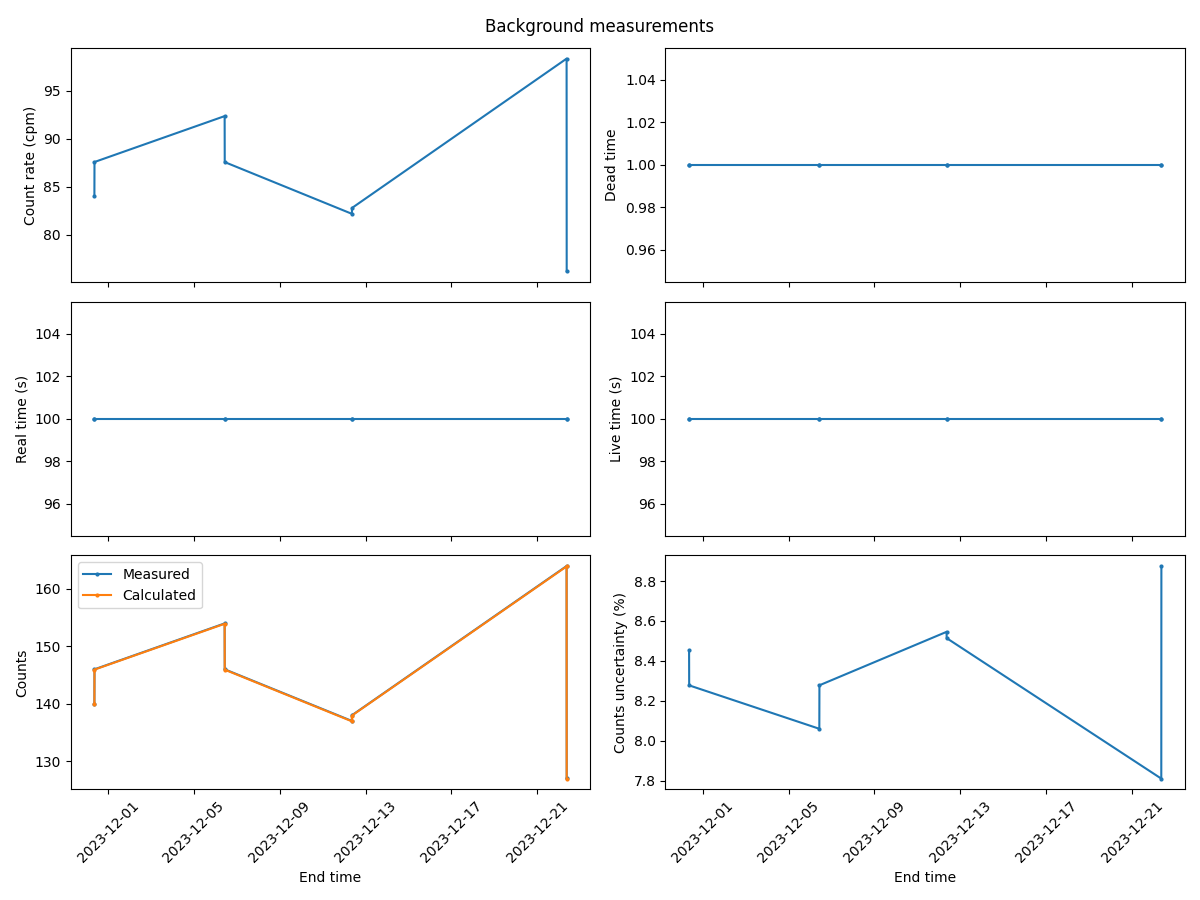
This plot show all the quantities of interest for the background measurements in terms of time: real time, dead time, live time, count rate and counts value and uncertainty. See more details about these quantities in the Topic guide.
Note
To plot background, sample or net measurements using the processor.plot_measurements() method,
you need to parse the readings first using the processor.parse_readings() method and
and process the readings using the processor.process_readings() method.
Otherwise, you will get an error.
Plot sample measurements#
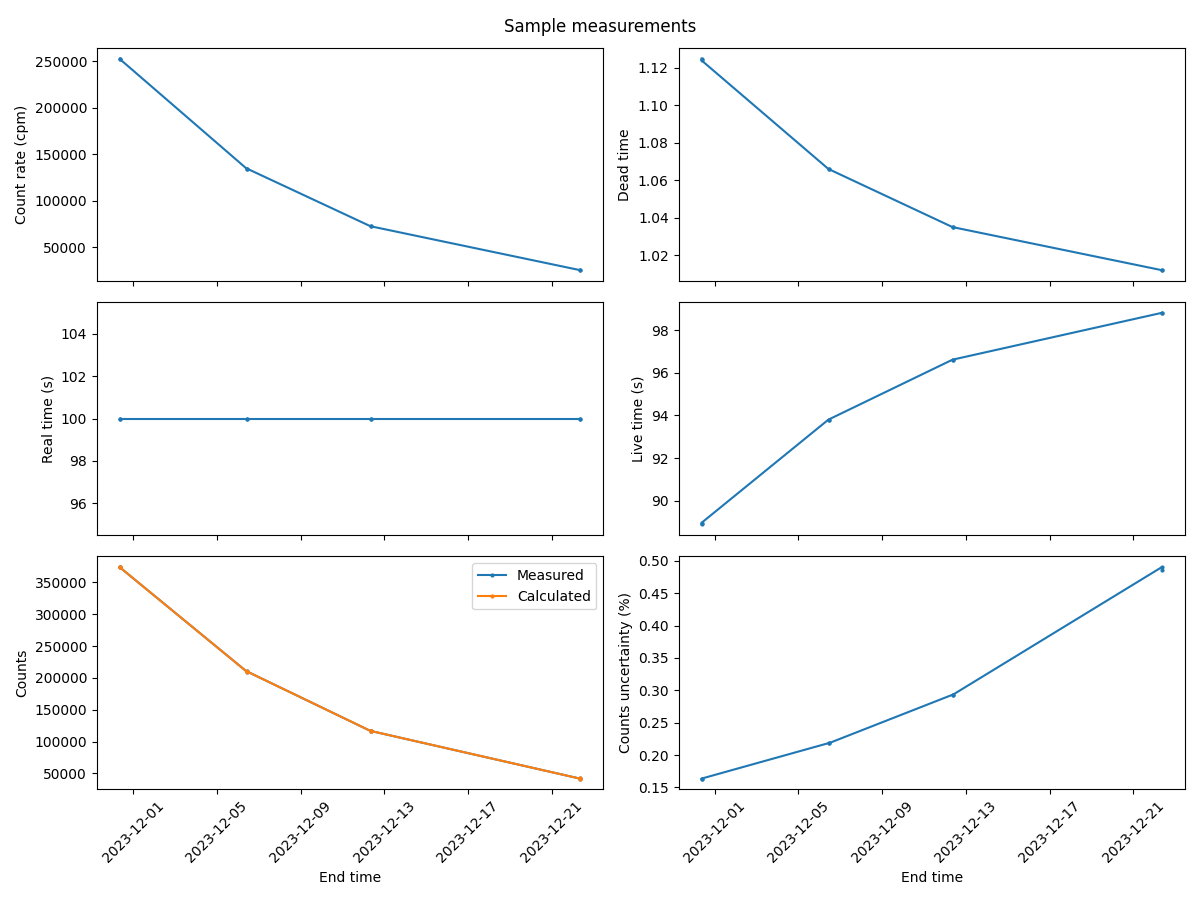
Next, you can plot the radionuclide sample measurements in the same way you just did for the background measurements.
Just use the processor.plot_measurements() method specifying the type sample instead of background:
Create and customize a plot for the sample measurements:
>>> processor.plot_measurements(kind='sample')
The returned plot will look like:
Plot net measurements#
Finally, you can process the radionuclide net measurements in the same way you just did for the background and sample measurements.
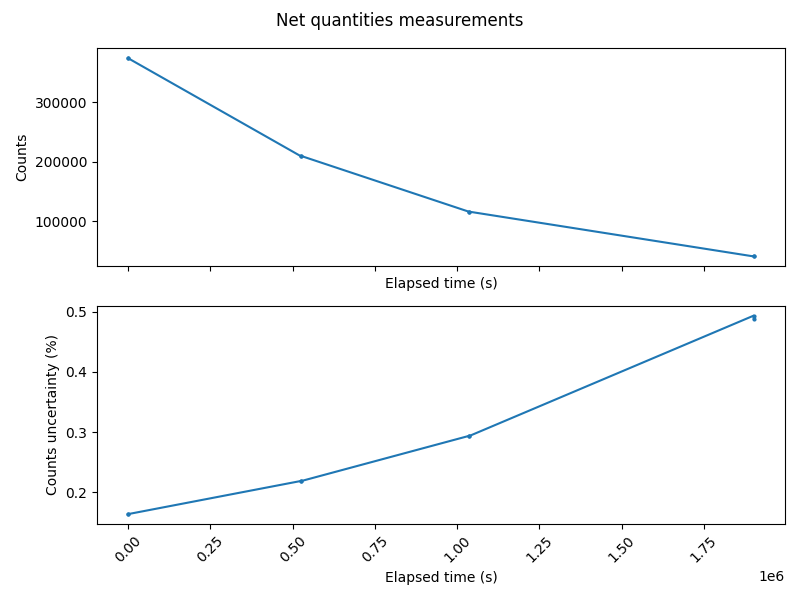
Just use the processor.plot_measurements() method specifying the type of measurements net:
>>> processor.plot_measurements(kind='net')
The returned plot will look like: